Monitoring running simulations is a powerful way to make workflows more robust. Instead of just submitting a job and waiting for it to finish, monitoring allows AiiDA to periodically check the status of a calculation while it is still running and, if needed, take action: e.g., stopping it, modifying parameters, or adjusting inputs dynamically.
This can be useful in many scenarios. For example:
- stopping a molecular dynamics (MD) simulation when the system volume exceeds a certain threshold,
- interrupting a DFT calculation that is stuck and not converging,
- stopping an experiment whose measurements are no longer of interest,
- or even tuning the behavior of a running simulation when the underlying code supports it.
Of course, if such dynamic behavior is used, care must be taken to maintain provenance, i.e., to track what was changed by the monitor, so results can be reproduced or understood later.
AiiDA Monitors: a new feature
AiiDA recently introduced the concept of monitors1, designed to make these kinds of live checks straightforward to implement and integrate.
Interestingly, this feature was initially motivated not by simulations, but by a study where AiiDA was used to orchestrate real-world experiments on batteries: P. Kraus et al., A bridge between trust and control: computational workflows meet automated battery cycling, J. Mater. Chem. A, 12, 10773 (2024).
Nevertheless, monitors are equally useful for simulation workflows. We will demonstrate this, and showcase how the feature works with a toy example below.
A toy example: monitoring a virtual thermometer
Imagine we have a Python script that emulates a room thermometer, called measure-temperature.py.
Every five seconds, it writes the current temperature to a file temperature.log.
It also checks for a file heating-on.json and if the file content is the value true (false), the temperature that will be printed will be slightly higher (lower) than at the previous cycle.
After 30 iterations (about two and a half minutes), the simulation ends.
Our goal: We will use AiiDA to run this script remotely and monitor its behavior, automatically turning the heating on and off to maintain a target temperature.
Step 1: Set up the working folder
Start by creating a folder for this example:
mkdir aiida-monitor-example
cd aiida-monitor-example
Alternatively, you can find everything set up for you already in the aiida-blog-snippets GitHub repository in the monitor-example subdirectory (we will still outline the setup, files, and code to run the example here, for you to follow along).
Inside it, create a scripts folder containing the thermometer script under the path scripts/measure-temperature.py:
#!/usr/bin/env python3
import time
import json

log_file = "temperature.log"
control_file = "heating-on.json"

temperature = 19.0

with open(log_file, "a") as f:
    f.write(f"{temperature:.2f}\n")

for _ in range(30):
    try:
        with open(control_file, "r") as cf:
            heating_on = json.load(cf)
    except (FileNotFoundError, ValueError):
        heating_on = False

    if heating_on:
        temperature += 0.25
    else:
        temperature -= 0.15

    with open(log_file, "a") as f:
        f.write(f"{temperature:.2f}\n")

    time.sleep(5)
You can try to run the script (python scripts/measure-temperature.py) to confirm it is working.
Step 2: Using a PortableCode
We will run this simple script using a PortableCode: a convenient AiiDA feature that automatically transfers a local executable to the remote computer before running it2.
Here’s how you can define one via the Python API (you don’t need to run it, we will provide a full script later):
from pathlib import Path

from aiida.orm import PortableCode

code = PortableCode(
    filepath_executable="./measure-temperature.py",
    filepath_files=str(Path("scripts").resolve()),
)
code.label = "measure-temperature"
code.store()
This will copy the content of the scripts folder into AiiDA’s repository (specifically in the repository for the Code node) and mark the file measure-temperature.py as the main executable, as well as copy it to the remote computer at every run that uses the code.
The label measure-temperature is also set in order to easily load it with load_code and to identify it in the output of verdi code list.
Step 3: Writing the monitor
A monitor in AiiDA is a Python function that is periodically executed while a CalcJob is running.
Full documentation for this feature can be found on this AiiDA documentation page.
For the purpose of this post, you just need to know a few things. A monitor is a Python function whose first two parameters are:
node(aCalcJobNode)transport(an AiiDATransport)
AiiDA provides both automatically every time the monitor function is called, so the monitor can inspect remote files and possibly modify them on the fly.
The function can also have additional parameters.
Moreover, by (optionally) returning a string (rather than None), it communicates to AiiDA that it wants to stop (kill) the calculation.
In our case, we’ll write a monitor that:
-
reads the last value in
temperature.log, -
compares it to a target temperature
target_T, -
and updates
heating-on.jsonto turn the heater on or off.Specifically, it sets the content of the file to
trueif the temperature goes belowtarget_T - delta_T(turn on heating), tofalseif it goes abovetarget_T + delta_T(turn off heating), otherwise it does nothing.
The two filenames to monitor/update can be optionally customized via additional parameters of the function, as well as the target temperature target_T and the accepted temperature fluctuation delta_T.
Create the folder src/aiida_monitor_example and add the following code to src/aiida_monitor_example/__init__.py:
import json
import tempfile
from pathlib import Path

from aiida.orm import CalcJobNode
from aiida.transports import Transport

__version__ = "0.1.0"

def monitor_temperature(
    node: CalcJobNode,
    transport: Transport,
    target_T: float = 20.0,
    delta_T: float = 1.0,
    log_file: str = "temperature.log",
    out_file: str = "heating-on.json",
) -> str | None:
    folder = node.base.attributes.get("remote_workdir")

    with tempfile.NamedTemporaryFile("r") as tmp_log:
        try:
            transport.getfile(str(Path(folder) / log_file), tmp_log.name)
            lines = tmp_log.readlines()
            last_temp = float(lines[-1].strip())
        except Exception as exc:
            node.logger.warning(f"Error reading {log_file}: {exc}")
            return

    if last_temp > target_T + delta_T:
        content = False
    elif last_temp < target_T - delta_T:
        content = True
    else:
        return

    with tempfile.NamedTemporaryFile("w") as tmp_out:
        json.dump(content, tmp_out)
        tmp_out.flush()
        try:
            transport.putfile(tmp_out.name, str(Path(folder) / out_file))
        except Exception as exc:
            node.logger.error(f"Could not write {out_file}: {exc}")
Step 4: Registering the monitor
AiiDA discovers monitors through entry points, so we must register our function as part of a simple Python package.
Add the following pyproject.toml in your main folder:
[build-system]
requires = ["setuptools>=61.0"]
build-backend = "setuptools.build_meta"

[project]
name = "aiida-monitor-example"
version = "0.1.0"
description = "Example AiiDA plugin with a monitor"
authors = [{ name = "Giovanni Pizzi" }]
dependencies = [
  # TODO: Check which main features we use over 2.7.2
  "aiida-core @ git+https://github.com/aiidateam/aiida-core.git@ca143ca29879bc4d5fcbae211272d0b94879eca5",
  "aiida-shell>=0.8.2",
  'matplotlib~=3.3,>=3.3.4',
]

[project.entry-points."aiida.calculations.monitors"]
"monitor_example.monitor_temperature" = "aiida_monitor_example:monitor_temperature"
Then install it locally:
pip install -e .Step 5: Running the monitored simulation
We’re now finally ready to submit the job!
Since the code to run (that we wrote earlier) is simply a script, we don’t need to write a full AiiDA plugin.
We will instead use the ShellJob interface provided by aiida-shell (if you want to know more about aiida-shell, you can check this previous blog post that describes it in detail).
Save the following script as submit.py (we describe its main parts below):
from pathlib import Path

from aiida import orm, engine
from aiida_shell import ShellJob
from aiida.common.exceptions import NotExistent

monitors = {
    "temperature_monitor": orm.Dict(
        {
            "entry_point": "monitor_example.monitor_temperature",
            "minimum_poll_interval": 5,
            "kwargs": {"target_T": 20.0, "delta_T": 1.0},
        }
    )
}

metadata = {
    "options": {
        "output_filename": "temperature.log",
        "additional_retrieve": ["temperature.log"],
    },
    "computer": orm.load_computer("localhost"),
}

code_label = "measure-temperature"
try:
    code = orm.load_code(code_label)
    print(f"Using existing code: {code}")
except NotExistent:
    code = orm.PortableCode(
        filepath_executable="./measure-temperature.py",
        filepath_files=str(Path("scripts").resolve()),
    )
    code.label = code_label
    code.store()
    print(f"Created new code: {code}")

inputs = {"code": code, "metadata": metadata, "monitors": monitors}
node = engine.submit(ShellJob, **inputs)
print(f"{node=}")
Here is a brief explanation of the script:
-
The first part of the script defines the monitor we want to use (in the
monitorsdictionary), and the value of the additional parameters to the monitor function. Note that in principle, multiple monitors can be attached to the same CalcJob. -
We then prepare the metadata options of the
CalcJob, defining a main output file, and asking AiiDA to retrieve thetemperature.logfile in the AiiDA repository at the end of the run. -
We then create the
PortableCodeas we discussed before (here, we add some logic to avoid to create it if a code with the same label already exists, so that we can run this submission script multiple times, reusing the same code). -
Finally, we run the code by passing as input both the
metadataand themonitorsdictionaries.
You can now run this script with
verdi run submit.py(Note that as we submit the job in the script, the AiiDA daemon must be running.)
While it runs, you can open another terminal and use:
verdi process list
verdi calcjob gotocomputer <PK>
(replacing <PK> with the PK of the running CalcJob that you have found from the output of verdi process list) to inspect the files temperature.log and heating-on.json while the simulation is running.
Step 6: Retrieve the simulation results
When the simulation completes (after about 2 minutes and a half), you can retrieve and plot the results.
In addition to copying the file content from the terminal that was opened by verdi calcjob gotocomputer, you can also get the temperature.log file from the AiiDA database (since we asked to retrieve it):
-
run
verdi process show PKwith the calcjob PK to see its output nodes; -
you should see a
SinglefileDatanode with labeltemperature_log; note its PK (let’s call this<SINGLEFILE_PK>) -
Show the content of the file stored in this
SinglefileDatanode withverdi data core.singlefile content <SINGLEFILE_PK>
Alternatively, you can use the following script (that you can e.g. save as plot.py and run with verdi run plot.py <PK>):
import argparse
import matplotlib.pyplot as plt
import numpy as np
from aiida.orm import load_node
parser = argparse.ArgumentParser(description="Plot temperature log from a CalcJob.")
parser.add_argument("pk", type=int, help="PK of the CalcJob node")
args = parser.parse_args()
calculation = load_node(args.pk)
logfile_output_node = calculation.outputs.temperature_log
output_png = "temperature_log.png"
with logfile_output_node.open() as fhandle:
plt.plot(np.loadtxt(fhandle), "o")
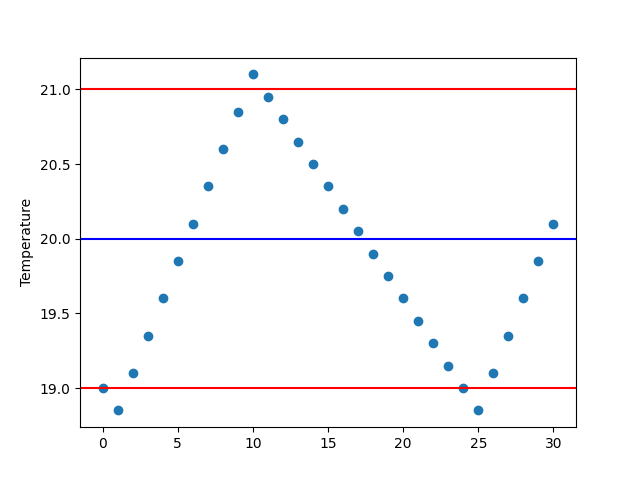
target_T = 20.0
delta_T = 1.0
plt.axhline(target_T, color="blue")
plt.axhline(target_T + delta_T, color="red")
plt.axhline(target_T - delta_T, color="red")
plt.ylabel("Temperature")
plt.savefig(output_png)
print(f"Saved plot to output file: {output_png}.")You should see a plot like the following one, showing how AiiDA’s monitor kept the temperature within the target range!
Conclusion and outlook
We hope that this simple example gave you a clear idea of what AiiDA monitors are and how to use them.
While our thermometer example is intentionally simple, monitors open up many possibilities.
We are already planning to implement some monitors for Quantum ESPRESSO in the aiida-quantumespresso plugin, and use them in workflows such as those of aiida-vibroscopy or aiida-muon, where large supercell calculations are run with Quantum ESPRESSO.
Indeed, in our experience it sometimes happens that the SCF loop for these large supercell calculations can get “stuck”, with the required threshold being reached, but the code not detecting it (and thus not proceeding with the next BFGS iteration, if a relaxation was requested).
A monitor could detect this and gracefully stop the Quantum ESPRESSO calculation, allowing AiiDA to restart it automatically (thanks to the restart handlers of aiida-quantumespresso) and continue the workflow efficiently.
Do you have other ideas for how monitors could help in your simulations? We’d love to hear about those on Discourse or GitHub!
Footnotes